
September 2008 Report (Posted September 3rd, 2008)
This publication is designed to provide accurate and authoritative information in regard to the subject matter covered. It is sold with the understanding that the publisher is not engaged in rendering legal, accounting, or other professional service. If legal advice or other expert assistance is required, the services of a competent professional person should be sought. From a Declaration of Principles Jointly Adopted by a Committee of the American Bar Association and a Committee of Publishers and Associations.
Copyright HarmonicTrader.com, L.L.C. 2008
This material is protected under all copyright laws. This material may not be reprinted or reused in any manner without the express written consent of HarmonicTrader, L.L.C. and Scott M. Carney. All rights reserved!
Greetings Harmonic Traders, As the "Fall of 2008" sets in, I am ready to move forward with the new Harmonic Trader Report series. Before I begin this report, I want to outline the general plan of how HarmonicTrader.com will move forward to expand and to organize these initial reports into what will become the new "The Harmonic Trader Report.” Each report will be posted approximately 3-4 pages that will cover the most pertinent markets and general investment environment for the months ahead. Although I will focus quite regularly on the most pertinent of U.S. markets, this will not preclude me from in-depth analysis of opportunities foreign markets and commodity-related issues. In particular, oil, agricultural commodities, currency futures and other critical sectors will comprise a thorough and accurate presentation of the financial landscape and the overall trading environment at hand. The Harmonic Trader report will be a subscription newsletter starting in November with the first one free to the public. There will be more details to follow in the next few weeks. Now, let's begin with the current report.
|
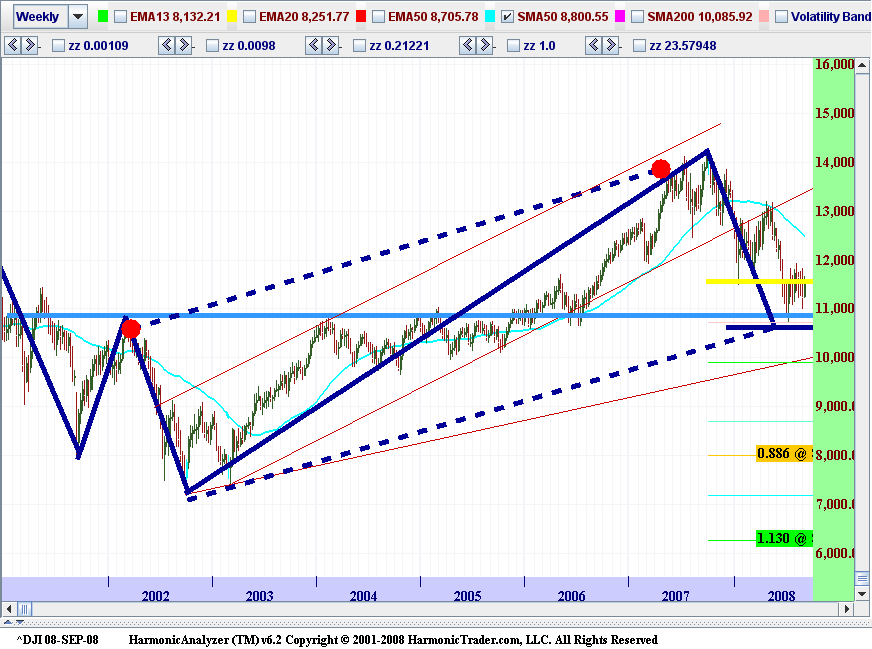
In the prior report from July, I outlined the scenario for the Dow Jones Industrial Average. The weekly structure possessed a distinct Bullish 5-0 pattern that identified the 10,500 level as a substantial target completion for this index. The index reversed sharply after a perfect test of the entire support range. The distinctiveness of the structure of this pattern suggested that the first test of this area would provide temporary support and a brief reaction at a minimum. Now that the index is in the process of an incredibly important retest of this substantial support, the primary question is: Will this area mark the low for the current downtrend. Although the severity of this decline does present a cautionary regard for the eventual failure of the 5-0 pattern, the support zone does offer other technical considerations that confirm its importance. In particular, Relative Strength readings are quickly approaching oversold on long-term timeframes and retesting extreme readings from earlier this year.
|
|
|
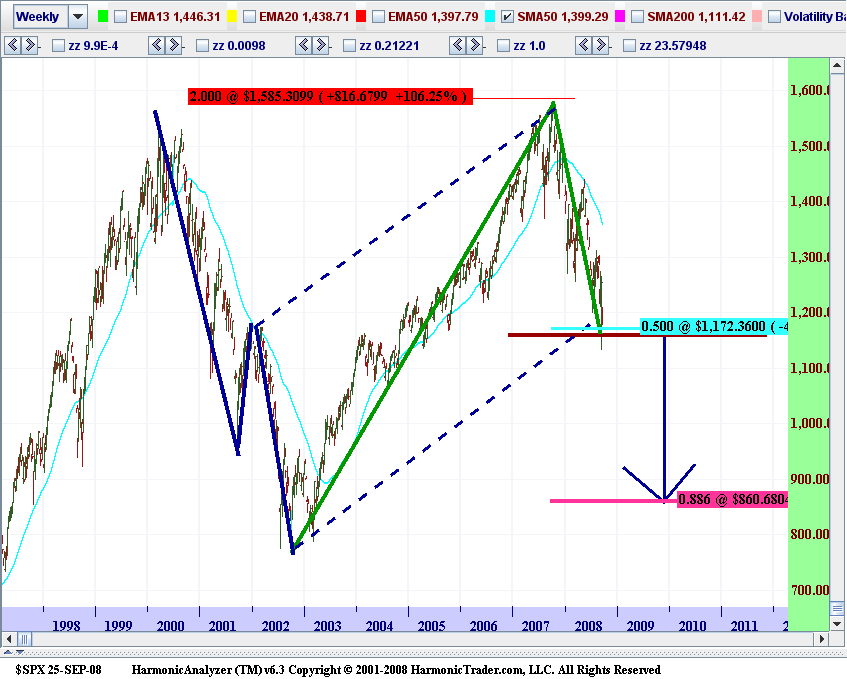
For the Standard & Poor's 500, the distinct 5-0 pattern points to the general 1150 area, as a last-ditch retracement that could potentially mark a historic low point for the index. The index reversed initially at the anticipated harmonic levels. For the S&P 500, it possessed a distinct range in the 1150-1170 area. The recent decline may suggest that an exhaustive drop into a substantial harmonic support zone will mark the end of the entire bear market. Although the capitulaton phase is trying to offer signals that it is nearing its completion, there are several considerations to regard as the next few days and weeks unfold. The indices must stabilize now or face the possibility of an entire retest of the last 8 years of price action. Specifically, the S&P 500 would trigger a much lower downside target at 880. Therefore, the recent lows must stabilize and begin to follow to the upside to confirm the recent substantial rally or face a full retest of the weekly lows.
The S&P 500 is representative of the state of all major equity indices and must find support in this general area. The index has hit a penultimate support area that represents a definitive make-or-break that will soon confirm the recent exhaustive reversal. |
|
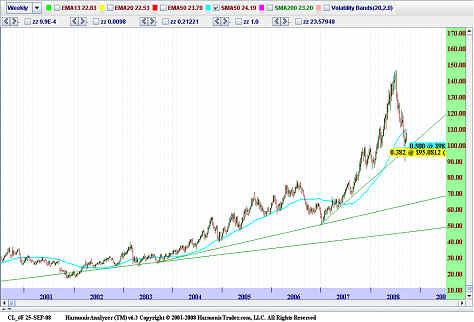
The crude oil market tested the critical weekly 38.2% harmonic support level that was outlined in my prior report from July. The initial report on crude was posted shortly after the extreme peak in the $147 area. I outlined a few of the most important technical considerations that defined the 95-110 area as a long-term support level. In particular, the weekly 38.2% retracement sits at $95 represented a critical long-term retest. The $95 area represents the current low of the support zone.
|
|
Without question, the current environment requires a great deal of caution. I recommend giving the major equity indices a few weeks to confirm the recent lows. My main point is that this is the time where significant harmonic patterns have completed that can define historic price levels. If the downtrend does not end in the next few weeks at these respective pattern completion points, the continuation will be severe. I would watch the S&P 500 in particular to gauge the extent of this confirmation. 1150 is the line in the sand. The next several weeks will be truly historic, as this entire situation - both technical and fundamental - resolves itself. And, if there was ever a time to be paying attention to the markets and your own finances, it is now! Good Trading,
Scott Carney
HarmonicTrader.com
Scott Carney
HarmonicTrader.com
